
Armoire Year In Review
Highlighting the value of an Armoire membership through year in review landing pages and dynamically-generated, shareable images
Company
Armoire Style
Timeline
2 Weeks
Responsibilities
UX Design
Front-End Engineering
Collaborators
Jeff Topham, Backend Engineer
Project Overview
Armoire is a consumer clothing rental company that offers its members access to a personalized closet of high-end styles.
As 2020 came to a close, the Armoire product team wanted to create a memorable, personalized "rental recap" for each member that would:
- Teach them about their style preferences and rental behavior
- Highlight the value that Armoire had provided to them in 2020
- Allow them to easily share their recap within and beyond Armoire
Timeline + Responsibilities
For the most part, this project was a solo effort. With the problem statement defined by the broader team, I owned the technical investigation, design, and front-end development of the finished product. I worked with our lead backend engineer to define the desired parameters and response for a new rental stats API. I also sought feedback from my co-workers throughout the process. I took the 2020 Year in Review from concept to finished product in roughly 2 weeks.
Technical Investigation
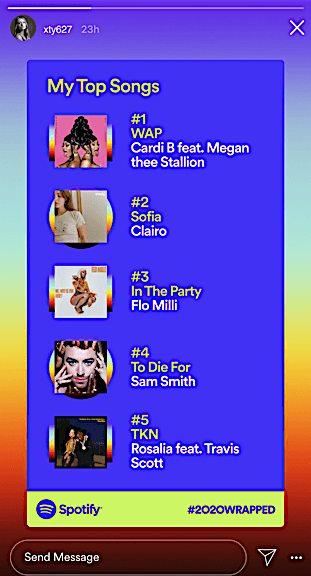
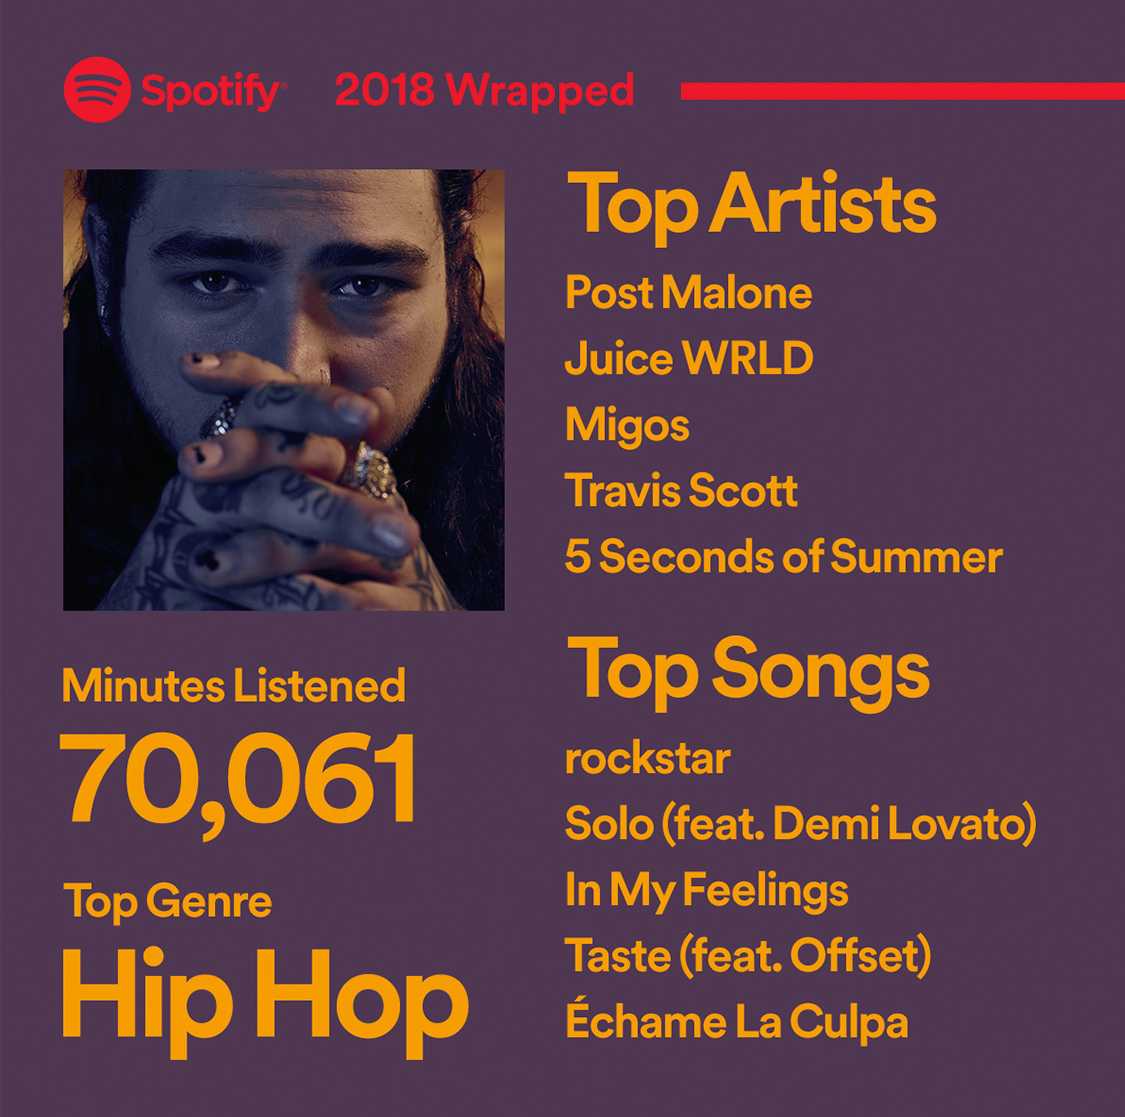
In my initial technical investigation, I focused on finding the best method for creating some sort of dynamically-generated asset (likely an image or video) for each member that they could save and share on social media. Inspiration included Spotify's Year in Review photos and Facebook's friendversary videos.
At that point in time, Armoire had a Django/Python backend and a Vue/HTML/Javascript web app. I investigated three potential methods for asset generation within these architectures:
- Pillow – Python Image Processing library
- MoviePy – Python module for video editing
- html2Canvas – Node library that takes "screenshots" of websites
After researching the advantages and limitations of each of these libraries, I created rough proof-of-concepts for each method of asset generation. I used these to evaluate various aspects of the potential Year in Review asset generation processes and end-user experiences.
| Python Library (Pillow or MoviePy) | html2Canvas | |
|---|---|---|
| Asset Generation Process | Assets are generated once for all clients via a Python script run on the server. | Assets are generated via JavaScript, which is run on the user's browser when their Year in Review landing page is loaded. |
| Asset Storage | Generated assets need to stored in an AWS s3 bucket. Urls to access these assets will also need to be stored on the database. | Assets will be available for download by the user from the landing page after generation. They will not need to be stored in any other way. |
| Asset Consistency | Assets will be generated on the same server for all clients and should thus be 100% consistent. | Some potential for inconsistencies in asset generation across browsers. However, more than 95% of users are on Chrome and Safari, and html2Canvas is supported on all major browsers. |
| Personal Technical Learning Curve | High | Low |
| Visual Layouts Available | Limited | Akin to options available for HTML web layouts. Only a few small gaps in support for certain CSS properties. |
| Time to build complementary landing page? | Limited – If using Movie.Py, likely not in scope. | Yes – Required for asset generation. Code can be shared across landing page layouts and the generated images. |
| Perceived performance | Fast – Asset generation happens before the user interacts with the experience. | Slower – The browser has to generateassets when the experience is loaded, so the initial load time will be roughly 6 seconds or longer. |
There was clearly no "perfect" solution, especially considering I only had 2 weeks to complete the project. I ultimately chose to work with html2Canvas because I believed that the combination of an interactive, exploratory landing page and shareable images would be most engaging and memorable for our users.
Perceived performance, though important, was a lower-tier consideration for this experience, because is was not mission critical.
This method of generating images from html layouts on the browser was admittedly unconventional, but I found it to be worth it because it enabled rapid iteration (which often characterizes web development) and allowed me to reuse code between the image layouts and landing page elements.
Content + Design
To determine the Year in Review content, I crowd-sourced ideas from Armoire members and my co-workers using Slack and Facebook channels, asking what they would like to learn about their own rental behavior on Armoire. The most popular stats surfaced included:
- Top brands rented
- Top patterns, colors, and item categories rented
- Most expensive item rented
- Rented items kept the longest
- Most popular posts in the Armoire feed
Technical Learnings
SVG Shapes + Patterns
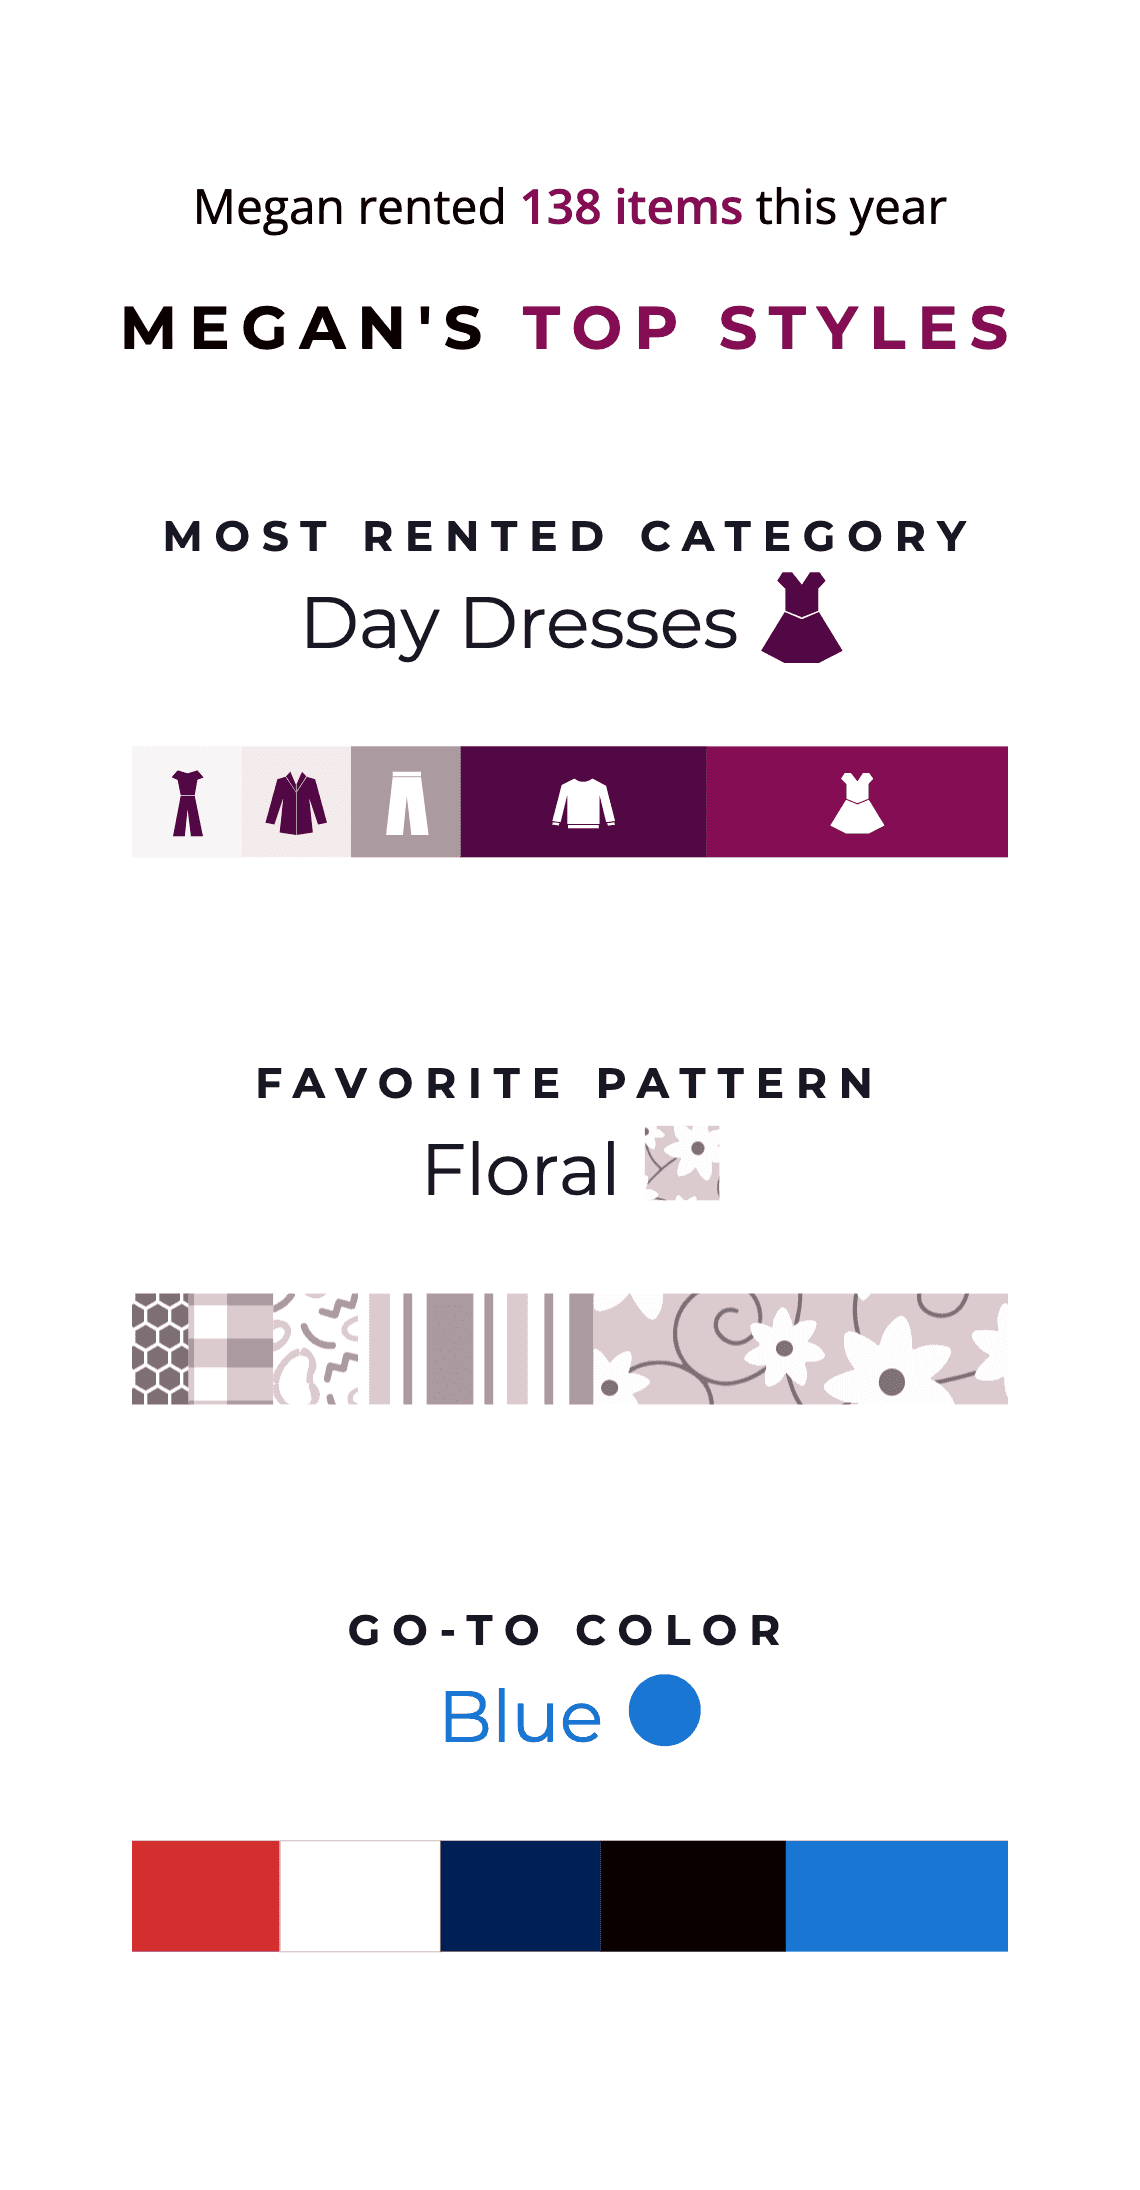
In order to show a breakdown of the top 5 colors, patterns, and items rented most often by each user, I wanted to create distribution graphs that could be used to visualize each of these attributes.
I chose to display these with horizontally stacked distribution graphs with labels underneath, because I felt that this data pattern worked on both mobile and web, and most elegantly handled different data edge cases (low data, uneven distributions, etc).
I used SVG shapes to create these graphs, because their styling and positioning is fully supported by the html2Canvas renderer. It also allowed me to use SVG patterns for displaying the pattern distributions, scaled across any size of shape, and an SVG filter to create an effect on hover across patterns and colors.
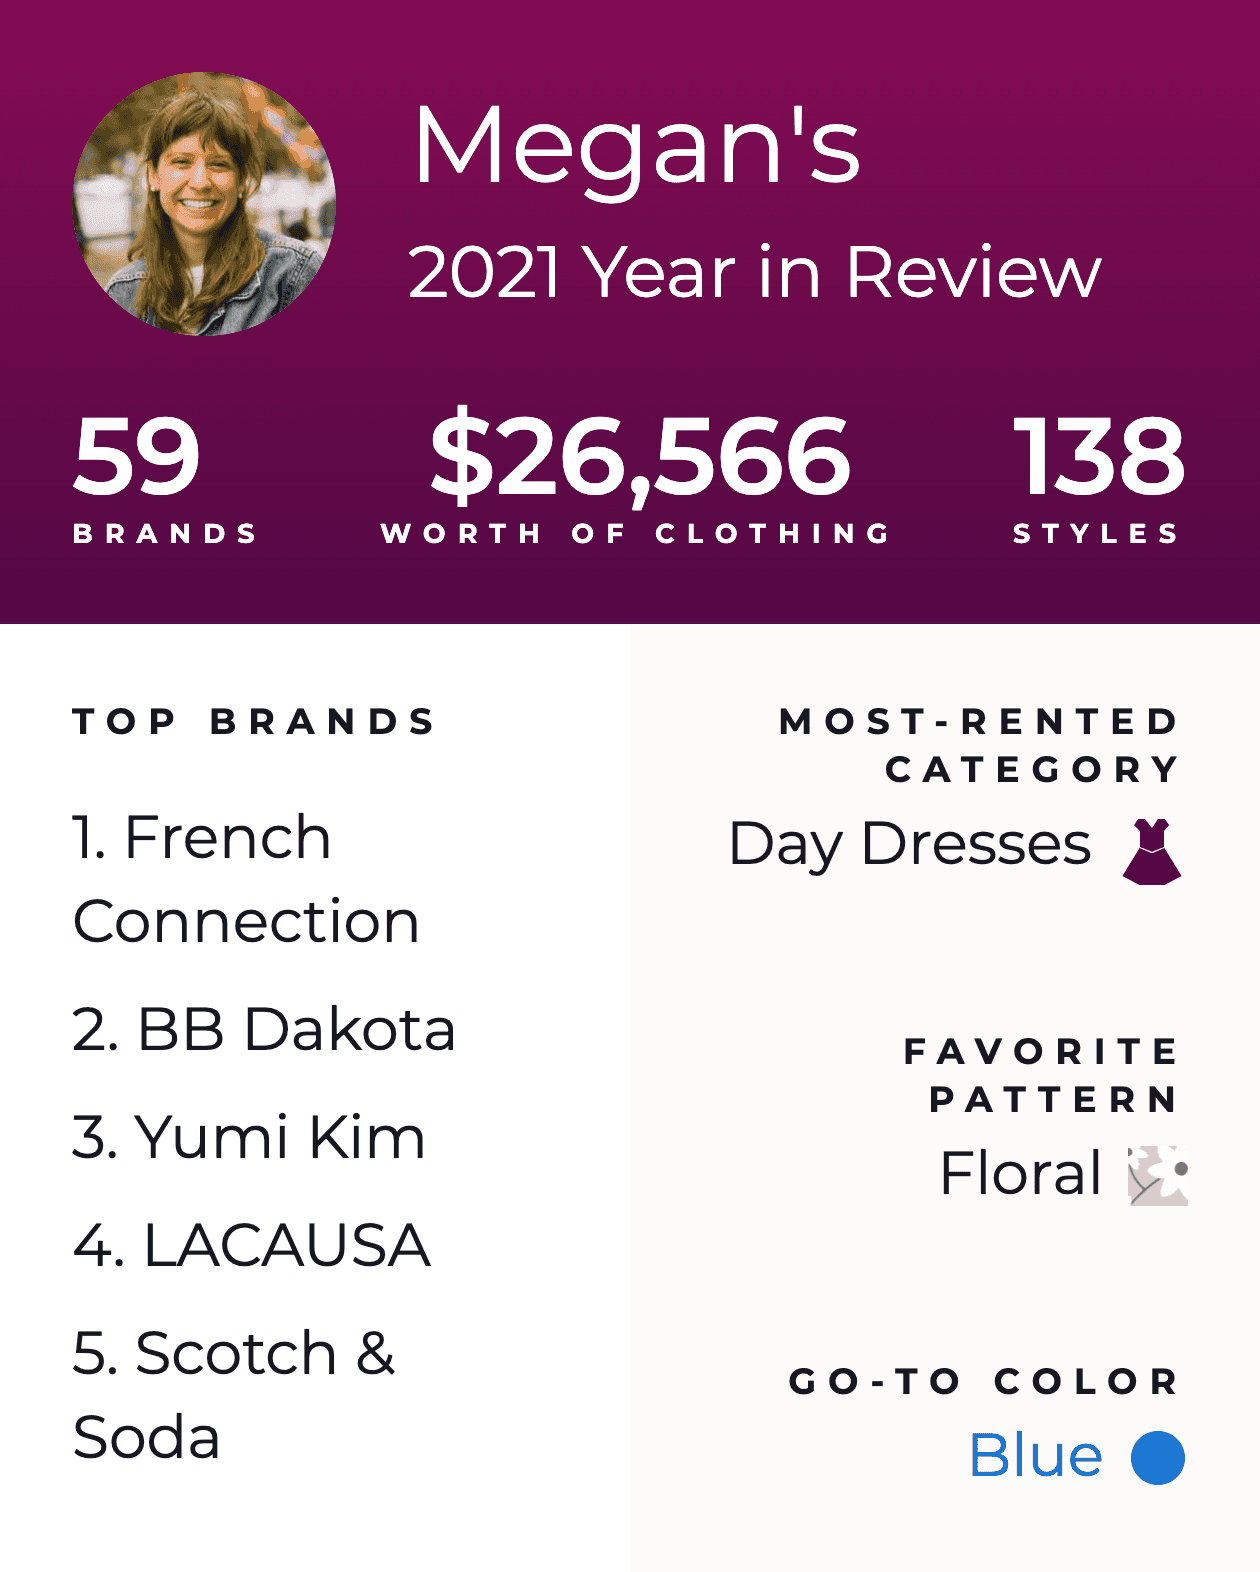
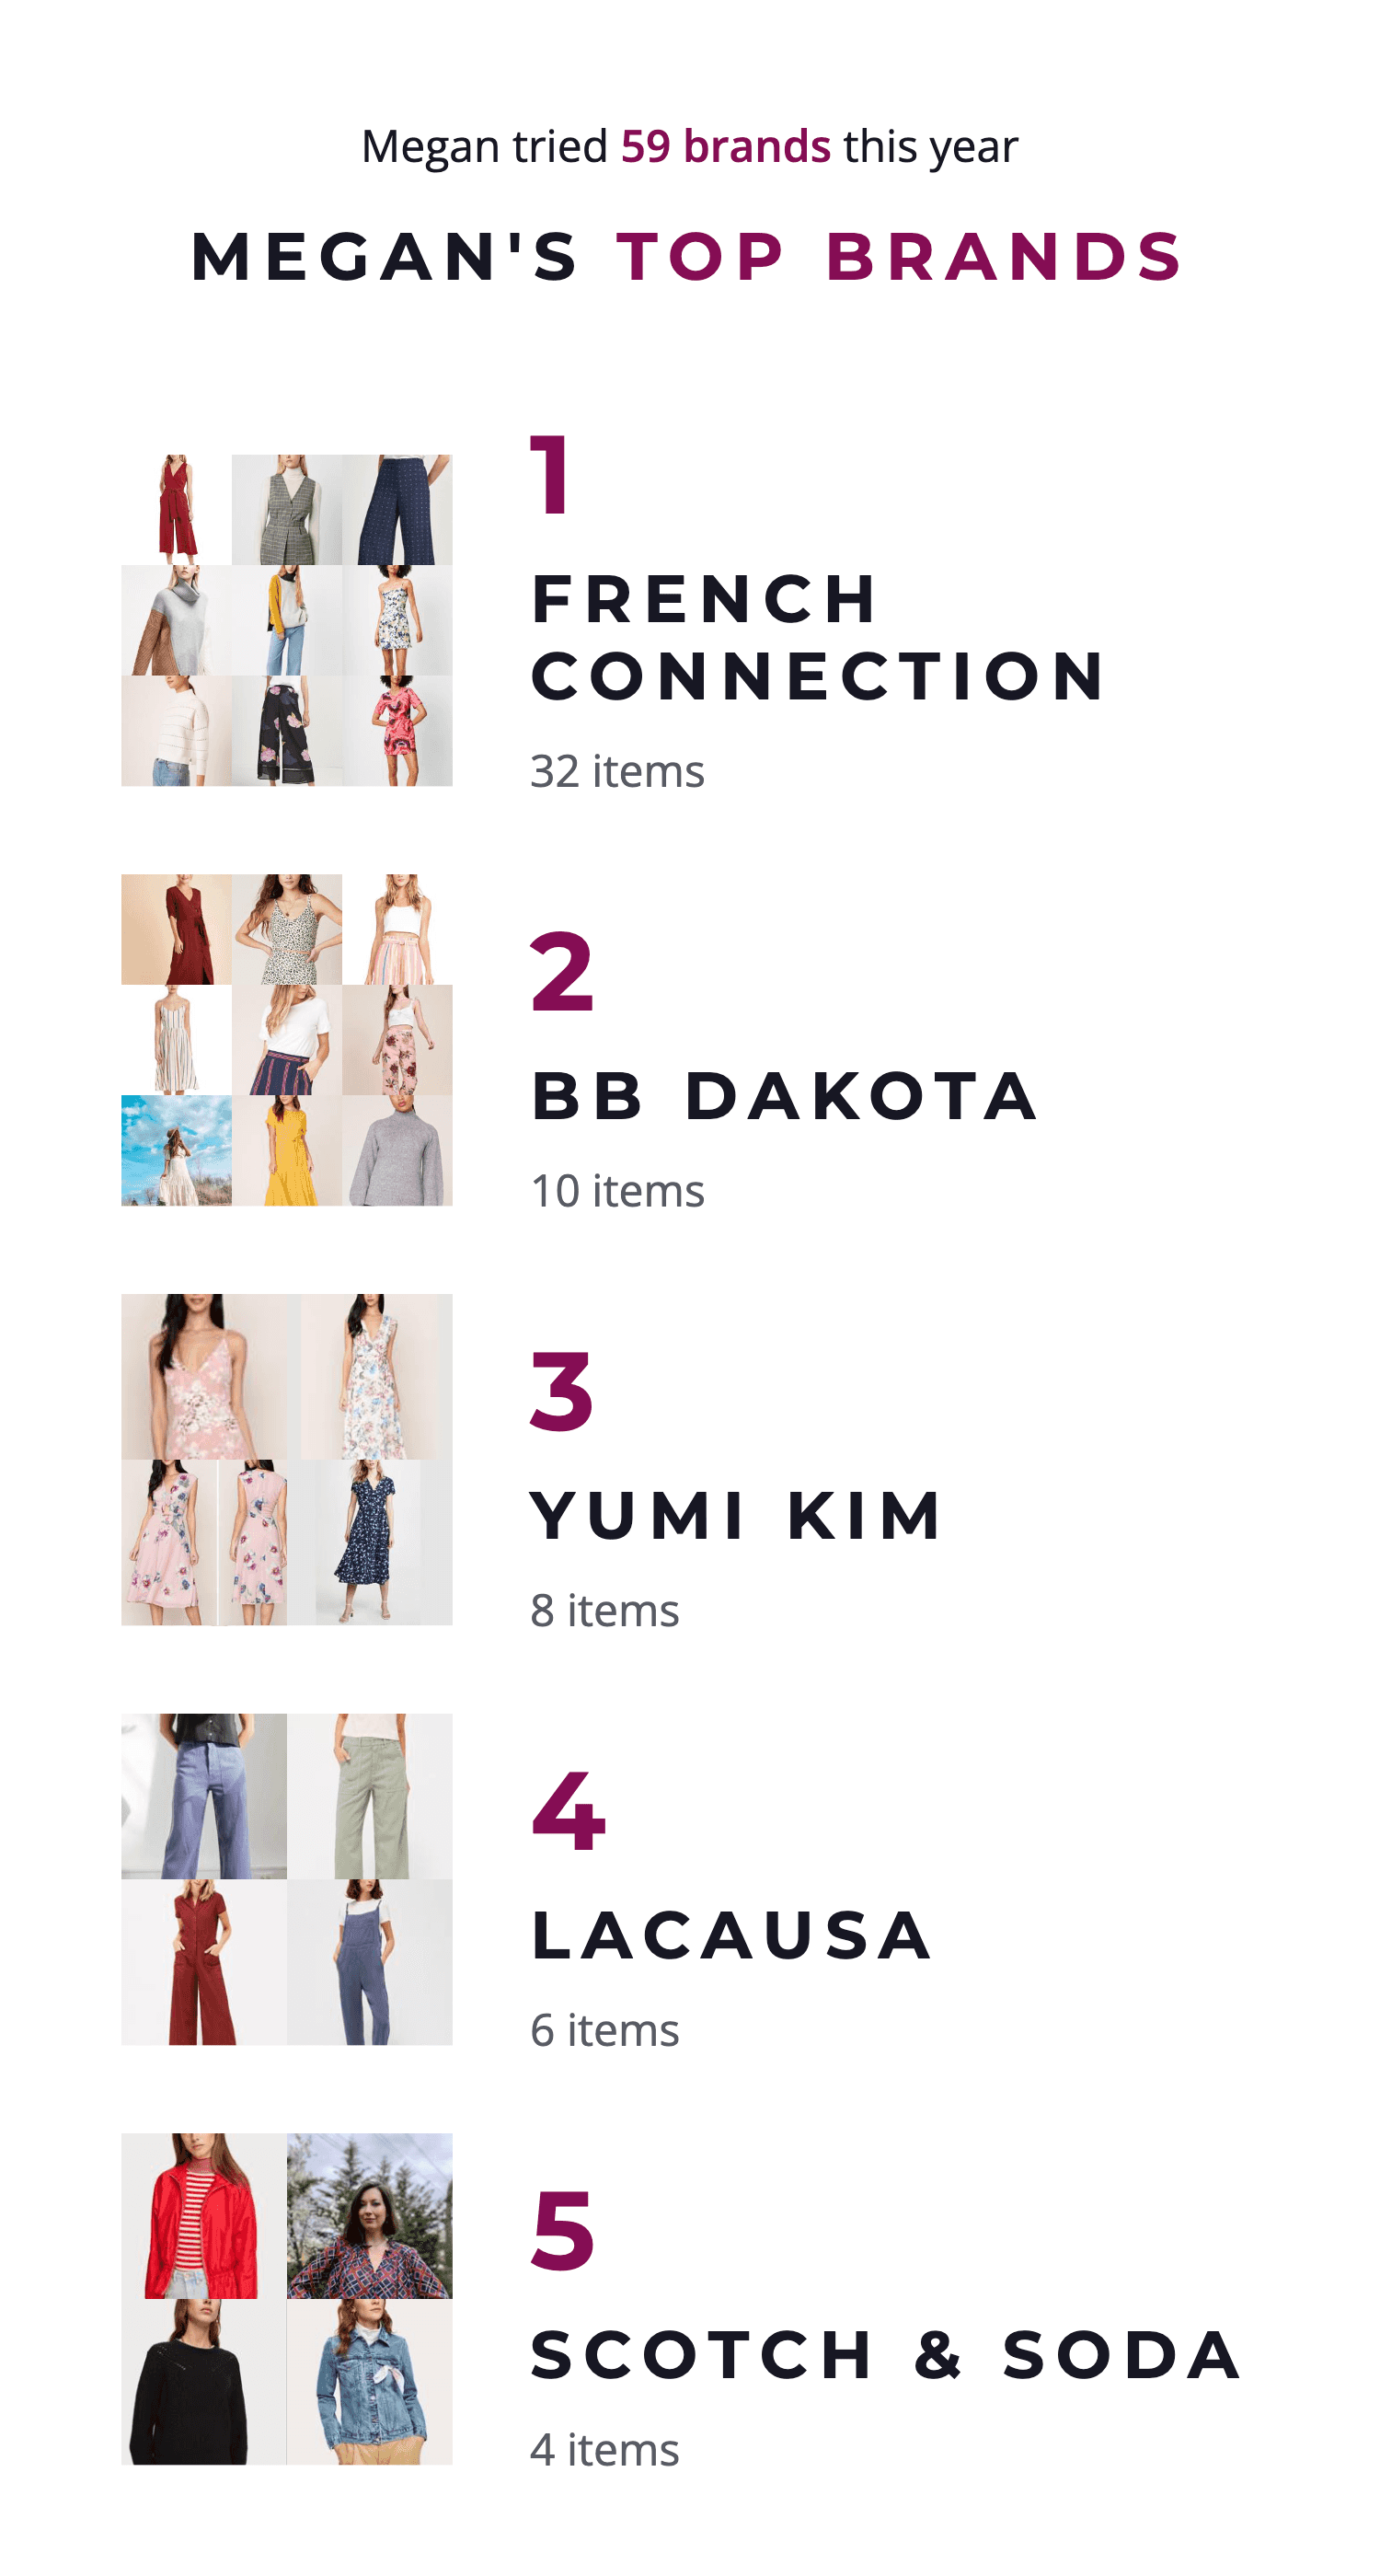
Final Product
You can check out a live version of my 2021 Year in Review here, and view the final walkthrough below.
Walkthrough Video
Generated Images
Reflection
Given more time or the ability to work with more design collaborators, I would have loved to improve the visual design of this work, as I feel it is somewhat heavy and dense. I also would have liked to add more movement / animation to the overall flow.
Additionally, it became clear after launch that the SVG graphs I had created were not as obviously interactive to users as I had hoped. Having more time to explore and test different data visualization patterns for these graphs would have been ideal, especially since I worked so hard to make sure they elegantly adapted to all sorts of data scenarios.
In all, I'm very proud of what I was able to produce in 2 weeks, and the way I was able to create shareable images using html canvas. Reception of the feature was extremely positive, with several members sharing their rental stats both on our in-product feed and on their social media channels.